If you have ever read any article or app on algo or systematic trading or just ever listened to CNBC, most likely you have already heard about alpha– and beta-generating programs (strategies, systems, funds, you name it). And as is quite often the case with heavily used terms, not everyone who uses them really understand their meaning. Let’s shed some light on this terminology, as understanding it will really help sort out the kaleidoscopic variety of trading strategies.
Alpha – earn from changes in price
According to the general definition of alpha, alpha (α) “is a specific measurement of the worth of an investment based on its performance relative to the market. Specifically, alpha measures the ability of an investment to beat market returns.”
Sounds familiar? Most likely yes if you are interested in markets and trading (otherwise, why would you be reading this app?)
But is it clear and understandable? No, as this definition replaces one unknown term (alpha) with another (beat the market, which is often also called edge).
The article goes on with “Alpha is synonymous with abnormal rate of return.” Why abnormal? Because the efficient market theory claims that there is no way to systematically outperform the market, thus any excess return can be considered abnormal. This makes much more sense, as now we understand that alpha is a metric that compares the return of a strategy, portfolio, or investment to a benchmark (referred to as broad market in the preceding article).
In simpler words, there is a benchmark and there’s the return of a trading strategy. If the latter is greater than the former, then the strategy generates alpha.
Simple? Yes, but we have to make two important remarks.
First, it is essential to note here that by beating the market, the alpha approach only considers the manipulation of underlying assets, such as selling short, exiting positions and re-entering at different prices, changing the proportion of assets in a portfolio, and so on.
Note
In other words, generating alpha normally means the active manipulation of the assets themselves, without the use of derivatives or sell-side activities, such as market making.
Second, there is a problem that is frequently overlooked: we do need that very benchmark against which we’re going to compare the returns of a trading strategy.
When we talk about investment, the benchmark is obvious: a stock index. One of the most popular benchmarks of this kind is the S&P 500 – the index of 500 large-capitalization US companies. You can buy shares from all these companies and follow the index by holding them, for example, for 1 year. Alternatively, you can buy only some shares in a proportion other than in the index, buy different shares, sell some shares and replace them with others, or make any other active investment – but when you compare your returns with the return of the index at the end of that very year, and if you did better than the index itself by manipulating the market exposure, then you can say that you generated alpha.
Why does this approach make sense in equities investing?
If we look at the entire history of the S&P 500 index, we can immediately see that the US stock markets always grow over time. Yes, there are recessions, and there was even the Great Depression, but in the very long run, if you buy shares from all companies from this index and wait for over 30 years, then you will almost for sure make a profit.
Don’t take my words for granted: check any source for S&P 500 historical data and you will see it yourself. The following is a chart by Yahoo! Finance in semi-log scale:
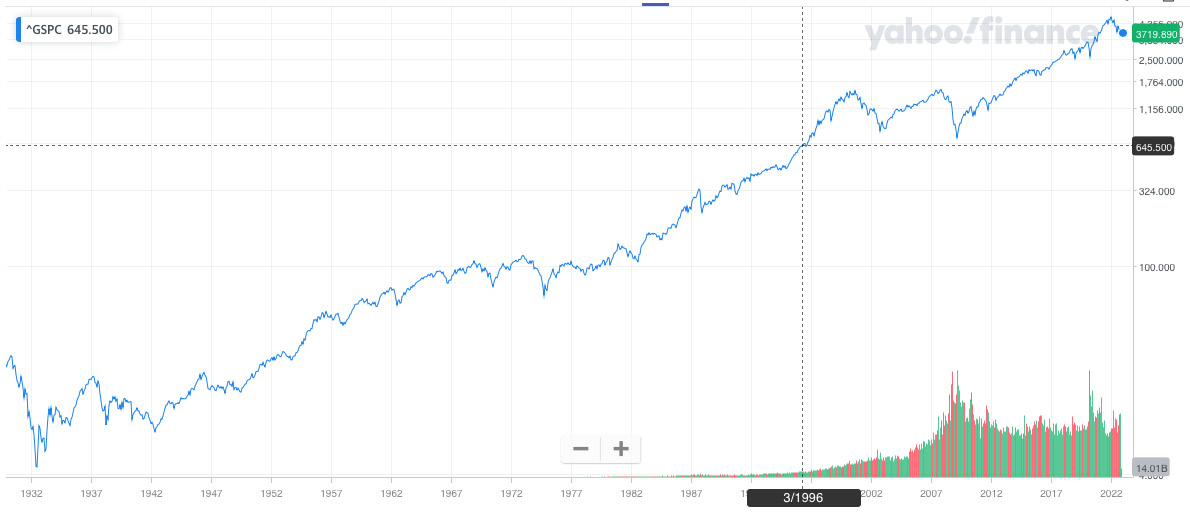
Figure 9.1 – Historical data of the S&P 500 index shows that the US stock markets have a strong tendency to grow over time
With FX trading, it’s more complex and confusing because currencies are not normally used as long-term investment vehicles – at least as widely as equities. The reason is that currencies feature interest rates, something that makes them radically different from traditional investment assets (see the Economic news section in Lesson 6, Basics of Fundamental Analysis and Its Possible Use in FX Trading, for a discussion on carry trading) and these interest rates change over time based on central banks’ decisions. So, when you buy and hold a stock, it normally brings you dividends, or in the worst case, you just don’t receive anything if the board decides not to pay dividends this year. However, if you buy and hold a currency, it’s quite possible that you pay for the luxury of having this currency in your portfolio – if the difference in the interest rates between the two currencies in a pair is negative.
Using and abusing S&P 500 as a benchmark
Because of the enormous popularity of the S&P 500 index, it is frequently used as a benchmark for everything, not only investing in stocks. I have even witnessed a comparison of this index to the performance of a high-frequency trading fund. Of course, this has nothing in common with the traditional meaning of alpha, beta, and other metrics.
So, it’s clear that we need a benchmark that is adequate for the specifics of the FX market. What can we use as such a benchmark then?
The simplest benchmark for FX trading strategies could be the currency itself.
Leave a Reply