These indices sometimes only serve indicative purposes; others are tradable instruments. For example, Deutsche Bank lists plenty of FX indices. Some of them represent classical buy and hold while others track Deutsche Bank’s own active investment. So, if you develop an alpha-generating strategy, then it makes more sense to compare its performance against one of these indices. Let’s consider an example.
Suppose you develop a basket trading strategy that buys undervalued currencies and sells overvalued ones. Then, it makes sense to compare the performance of your strategy to the Deutsche Bank FX Momentum USD Index and if your strategy delivers greater returns with lower volatility, then great – you make alpha with your strategy:
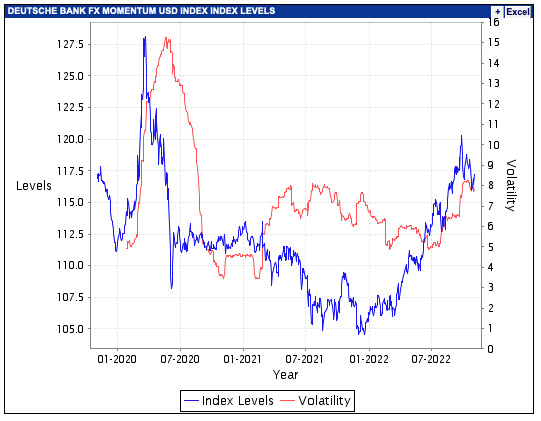
Figure 9.3 – Deutsche Bank FX Momentum USD Index chart
Overall, currency rates do not tend to grow over time perpetually. That’s why using their rates for a single currency or a basket of currencies as a benchmark does not make as much sense as using a stock index as a benchmark for investing.
Let’s summarize all of this. In the world of FX trading, by generating alpha, we assume that we will outperform any of the relevant FX indices – including the buy-and-hold return for a single currency – by actively manipulating the currencies in a portfolio. In this sense almost all buy-side strategies fall into this category (see Lesson 1, Developing Trading Strategies – Why They Are Different, to refresh your memory on buy-side and sell-side market participants). This is the very kind of strategy we’re going to consider further in this app.
Key takeaway
In the simplest terms, by alpha in FX trading, we mean making profits when the price goes anywhere, up or down. So, for alpha-generating strategies, the worst market is the one where the price doesn’t move sufficiently.
But is this really a problem? Do these markets exist – those where prices don’t change substantially?
Of course they do. Any FX market may become more or less volatile, mostly thanks to changes in liquidity and sometimes special conditions imposed by central banks. For example, let’s look at the chart of the euro versus the Swiss franc from April to September 2012, the time when the Swiss National Bank (SNB) decided to artificially peg the rate of the Swiss franc to the euro:
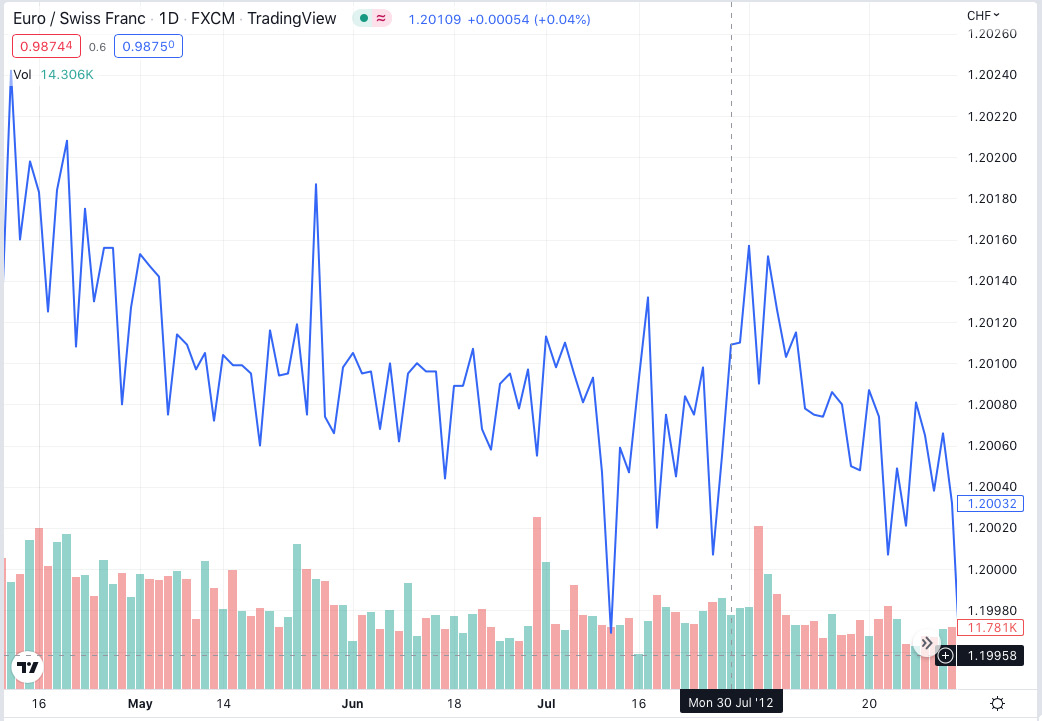
Figure 9.4 – Chart of the historical quotes of EURCHF (source: TradingView)
We can see that this currency pair had traded within a narrow range of only 26 pips for almost 5 months! Just to compare, the average daily range of the same currency pair as of November 2022 is 60 pips. Clearly, it was virtually impossible to generate any alpha in such a stable market.
But is there a way to still generate profits when the price doesn’t go anywhere?
The answer is yes, and now enter the second character of the play: beta.
Beta – earn on volatility
The concept of beta also originates in stock investment. It refers to the volatility of the returns achieved by the portfolio – and as in the case with alpha, again, versus a benchmark. Sure, in the case of stock trading, this is also usually a stock index, with the S&P 500 again being the most common example.
We already discussed market volatility in the Volatility indicators section of Lesson 7, Technical Analysis and Its Implementation in Python. The volatility of returns from an investment or a trading strategy can be studied in a more or less similar way. In investment and trading, beta is a measure of the risk of how much you can potentially afford to lose in order to achieve the expected profit.
To better understand the volatility of returns, let’s consider the example of traveling. Say, you want to get from London to New York. The most straightforward way to get from the starting point to your target is to take a direct plane. This route will be our benchmark. You can also enjoy a two-week trip by sea, which will be much slower and less straightforward. Otherwise, you can travel by car to France, then by train and bus to Norway, then by ship to Iceland, then by plane to Canada, and from there to New York by car, train, or bus.
See the difference? In all three cases, you get from the starting point to your target, but the volatility of your path will differ dramatically.
It’s the same with returns: let’s chart the hypothetical returns for two trading strategies (or investment portfolios, it doesn’t matter) over time. One of them would be less volatile and the other one more so:
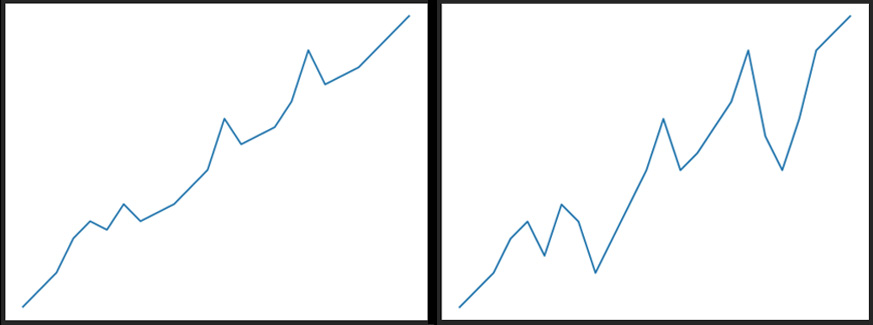
Figure 9.5 – Same start and destination, different volatility of a road trip or an investment
It’s clear that the volatility of returns for the right-hand chart is greater than in the left-hand one, and any normal investor or trader would prefer the latter. In the language of risk metrics, we say that the beta in the right-hand chart is greater than the beta in the left-hand one.
If we now look at the FX markets from the same standpoint as in the previous section, we can see that as is the case with alpha, it’s difficult to assess an investment versus a benchmark because no one invests in currencies like in stocks. So in FX trading, the beta could be interpreted as volatility of the market itself, and if a strategy profits from this volatility, then we say that this is a beta-generating strategy.
How can we earn on volatility rather than price movements?
It is possible by using one of the most complex yet powerful financial instruments – options.
Leave a Reply